The Pet Booking Lead Time Dashboard is an Excel workbook that measures calendar-day lead time from each booking request date to its service date. It organizes up to 100 booking records and automatically assigns valid lead times to configurable bands.
The workbook turns those records into practical scheduling indicators, including average lead time, performance against a target, service and status mixes, and prompts for date problems or possible scheduling pressure. These prompts support staff review; they do not directly measure available employees, kennels, or appointment slots.
How this workbook can help
- Makes the number of calendar days between each request and service date immediately visible.
- Identifies missing, invalid, or reversed dates before they distort lead-time reporting.
- Uses editable target and capacity-review thresholds to support consistent scheduling reviews.
- Summarizes booking status, service mix, average service lead time, and lead-time distribution in one dashboard.
What is in the file
How to get started
1. Review the scheduling settings
Open the Assumptions sheet and confirm the status choices, service types, lead-time bands, accepted date range, target lead time, capacity-review threshold, and pet-count limits. Keep the lead-time minimums in ascending order.
2. Enter each booking
Use one row per booking in rows 4 through 103 of the Bookings sheet. Complete the input columns A through H, including the booking ID, request date, service date, service type, pet count, assigned team member, and status.
3. Check the calculated fields
Review Lead Time, Lead Time Band, and Check Needed in columns I through K. Correct records marked Missing dates or Check dates, and investigate records marked Review capacity.
4. Read the dashboard and decide
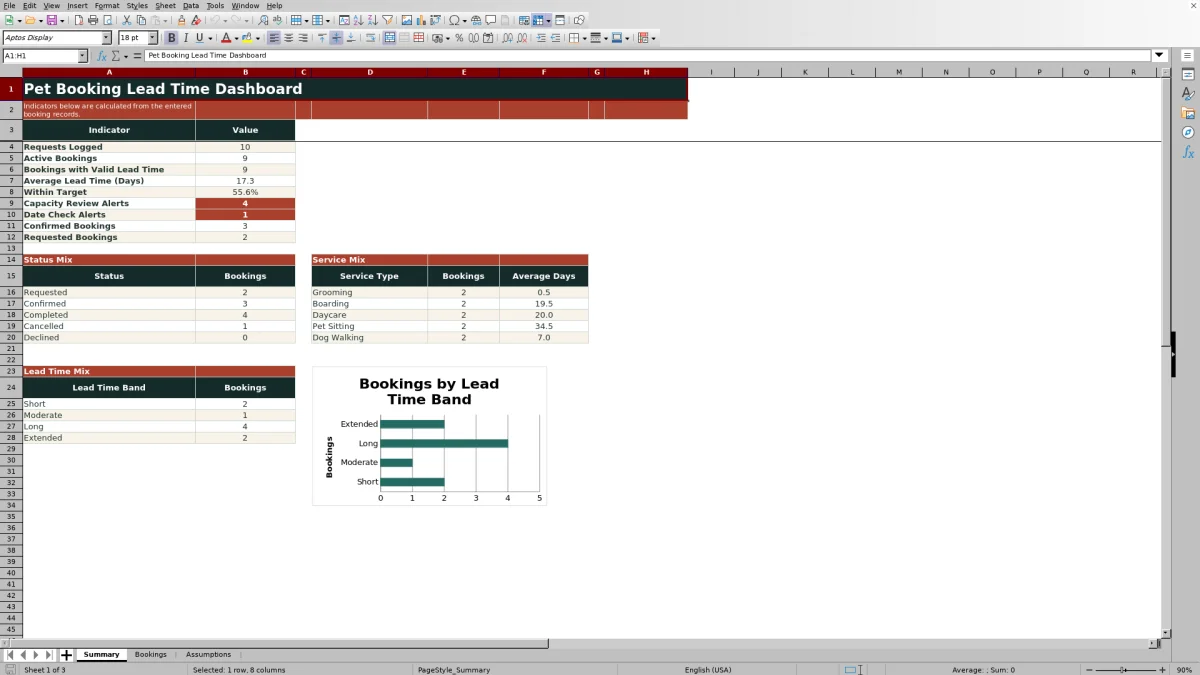
Use the Summary sheet to review average lead time, the percentage within target, alert counts, status mix, service mix, and the lead-time chart. Filter the Bookings sheet when a result requires investigation.
The Scheduling Situation This Dashboard Addresses
Pet service providers often know the service date but lack a consistent view of how long customers waited after making a request. Tracking lead time makes that gap measurable. A rising value can indicate demand pressure, limited appointment availability, or a service-specific bottleneck, although the workbook alone cannot determine which cause applies.
Action: Record Requests and Calculate Lead Time
Enter one booking per row on the Bookings sheet, using the request date as the starting point and the service date as the endpoint. The workbook subtracts the request date from the service date in calendar days, leaves invalid calculations blank, classifies valid results through the thresholds on the Assumptions sheet, and checks whether each result reaches the configured capacity-review level.
Errors and Solutions During Data Entry
If Check Needed displays Missing dates, add the absent request or service date. If it displays Check dates, verify that both entries are real Excel dates and that the service date is not earlier than the request date. A Check thresholds result in the band column calls for reviewing the ascending minimum-day values on the Assumptions sheet. Duplicate booking IDs, out-of-range dates, unlisted statuses or services, and pet counts outside the configured limits should be resolved by updating the source entry or the appropriate assumption—not by overwriting calculated columns. In short, correct the source data and retain the formulas in columns I through K.
Result: Read the Summary Indicators
The Summary sheet reports requests logged, active bookings, records with valid lead time, average lead time, the percentage within target, capacity-review alerts, date-check alerts, and separate counts for Requested and Confirmed bookings. Active Bookings includes Requested, Confirmed, and Completed statuses. Additional sections show counts by status, counts and average days by service type, and the four-band lead-time mix represented in the chart.
Practical Example and Interpretation
Consider four visible sample records. Comet has a one-day lead time, Waffles has 14 days, Juniper has 26 days, and Orbit has 39 days. With the default 14-day target and 21-day capacity-review threshold, Comet and Waffles are within target, while Juniper and Orbit meet the Review capacity condition. The interpretation is that two of these four examples are within target and two merit investigation; it is not proof that capacity is unavailable. Staff should next check the relevant service types, assignments, and actual slot availability before changing the schedule.
Comparison with Scheduling Alternatives
This workbook is most useful when the decision depends on elapsed request-to-service time. The comparison below clarifies how that purpose differs from tools that manage appointments or model physical capacity.
| Approach | Best used for | What it shows | What it does not show |
|---|---|---|---|
| Pet Booking Lead Time Dashboard | Monitoring request-to-service delay | Calendar-day lead time, target performance, bands, booking mixes, and review prompts | Real-time employee, kennel, room, or appointment-slot availability |
| Appointment calendar | Placing services into specific dates and times | Open and occupied appointment slots | Request-to-service trends unless request dates are separately tracked |
| Capacity utilization model | Planning staff or facility resources | Resource demand compared with available capacity | A reliable lead-time history unless booking request data is included |
Next Decision After Reviewing the Dashboard
When alerts or average days are high, use the service mix to identify where lead times are concentrated and filter the Bookings sheet to inspect the underlying records. The next decision may be to open more appointment slots, rebalance assignments, adjust customer expectations, or investigate a date-quality issue. If operating expectations change, update the target or capacity-review threshold on the Assumptions sheet, but avoid lowering a threshold merely to suppress alerts.
Frequently asked questions
What does pet booking lead time mean?
It is the number of calendar days between the request date and the service date. A same-day request and service produces zero days.
Does the workbook use calendar days or business days?
It uses calendar days. The calculation does not remove weekends or holidays.
Which statuses count as active bookings?
The Summary sheet counts Requested, Confirmed, and Completed records as active bookings. Cancelled and Declined records are excluded from that indicator.
When does a booking receive a capacity-review alert?
A valid booking receives Review capacity when its lead time is greater than or equal to the Capacity Review At setting. The default threshold is 21 days.
How many booking records can the workbook hold?
The prepared formulas, validations, filters, and Summary references cover 100 booking rows, from row 4 through row 103.
Can the statuses, services, and thresholds be changed?
Yes. The Assumptions sheet contains five status choices, five service-type choices, four lead-time bands, date limits, lead-time settings, and pet-count limits that can be edited within their validation rules.
Editorial responsibility

Tessa MarloweClient records and service workflows

Caleb HensleyWorkbook QA and operating controls