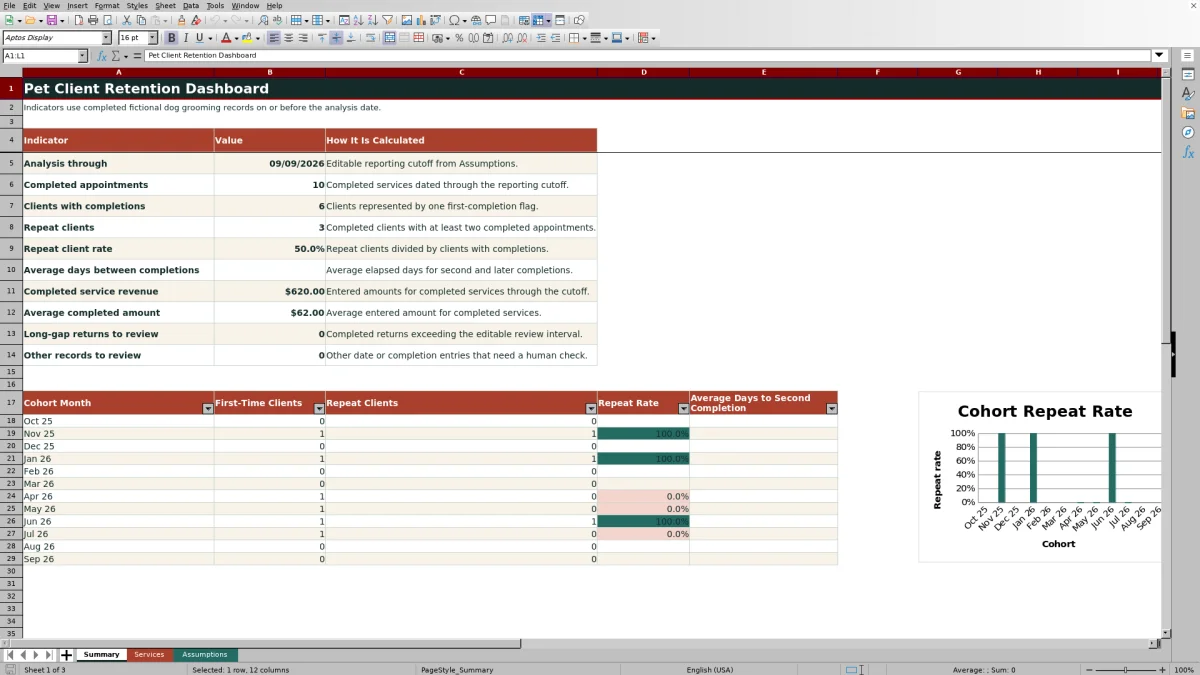
The Pet Client Retention Dashboard is an Excel workbook that turns appointment-level dog grooming records into client retention measures. It tracks completed-service retention, repeat-client rates, revenue, cohort performance, and the time between completed visits.
The XLSX includes a Summary dashboard, a 100-row Services log, and an Assumptions sheet for the reporting date, return-gap threshold, validation limits, service types, and statuses. Fictional records demonstrate the calculations, while review notes identify entries that may need a human check.
How this workbook can help
- Measures repeat-client activity from completed services recorded on or before an editable reporting cutoff.
- Groups clients by the month of their first qualifying completion for twelve-month cohort analysis.
- Shows service revenue and return intervals alongside retention indicators for practical performance review.
- Flags long return gaps, missing service dates, and completion dates beyond the reporting cutoff for review.
What is in the file
How to get started
1. Configure the reporting assumptions
Open the Assumptions sheet and set the analysis cutoff, return-gap threshold, acceptable amount range, and entry-date limits. The default cutoff is September 9, 2026, and the default long-gap threshold is 60 days.
2. Enter or replace service records
Use rows 5 through 104 on the Services sheet. Give every customer a consistent Client ID, then enter the client, pet, service date, service type, status, and amount. Use the supplied dropdowns for service type and status.
3. Review calculated fields and warnings
Check the calculated columns for prior completed date, days since prior completion, client segment, cohort month, completion sequence, and review note. Filter the Review Note column to investigate missing dates, future completion dates, or return gaps above the selected threshold.
4. Evaluate the dashboard
Open Summary to review completed appointments, clients with completions, repeat clients, repeat rate, average days between completions, revenue, average completed amount, review counts, and the twelve-month cohort chart.
Situation: Appointment Volume Does Not Show Retention
A grooming business can have a busy calendar without knowing whether customers return. A simple appointment count mixes first visits, repeat visits, bookings, cancellations, and no-shows. This dashboard narrows the analysis to completed services on or before the reporting cutoff so repeat behavior can be evaluated consistently.
Action: Set the Cutoff and Maintain Clean Records
Set the analysis date on Assumptions, then record each appointment with a stable Client ID, service date, status, and amount. Only records marked Completed and dated on or before the cutoff contribute to completed-service retention and revenue metrics. Booked, canceled, and no-show appointments remain visible in the service log without inflating those results.
Result: Interpreted Practical Example
The fictional client FX-001 has completed services dated November 6, 2025, February 11, 2026, and August 4, 2026, with amounts of $85, $58, and $92. With the September 9, 2026 cutoff, all three qualify, producing $235 in completed revenue for that client and a Repeat segment. The client belongs to the November 2025 cohort, reached a second completion after 97 days, and returned again after 174 days. Because both intervals exceed the default 60-day threshold, the records prompt review. The practical interpretation is that the client was retained, but the return cadence is longer than the chosen follow-up interval, supporting a decision to investigate timing or outreach rather than treating the client as lost.
Interpretation: Read Cohorts in Context
The cohort repeat rate shows how many clients who first completed a service in a given month have at least two qualifying completions by the analysis date. Average days to second completion describes the timing of that first return. Recent cohorts have had less time to generate repeat visits, so a lower recent rate does not automatically indicate declining loyalty; compare it with elapsed time, review notes, and older cohorts before drawing a conclusion.
Next Decision: Turn Findings Into Follow-Up
Use the next decision to match the observed pattern. A long-gap review note can support checking the underlying dates or considering customer follow-up. A low repeat rate in a mature cohort may justify reviewing service experience or rebooking practices. A low rate in a new cohort may call for more observation time. The workbook supports these decisions but does not contact clients or diagnose the reason for a delayed return.
Comparison: Retention Dashboard vs. Basic Service Log
This workbook adds retention calculations to a service log, but its fixed 100-row input area is not an unlimited database. The comparison below shows where each approach fits.
| Capability | Pet Client Retention Dashboard | Basic Service Log |
|---|---|---|
| Repeat-client analysis | Automatically classifies clients from qualifying completed services. | Requires manual review or separately added formulas. |
| Cohort measurement | Provides twelve monthly cohorts, repeat rates, and average days to second completion. | Usually records dates without calculating cohort outcomes. |
| Data checks | Uses dropdowns, date and amount validation, conditional formatting, and review notes. | May be simpler but can offer fewer consistency checks. |
| Scale and maintenance | Formula and input ranges stop at row 104 and must be extended for additional records; the workbook contains no Excel tables. | Can be easy to append, but added rows do not create retention analysis unless logic is built separately. |
The dashboard is the stronger alternative for a bounded dataset that needs repeat-booking analysis. A plain log is more appropriate when only raw appointment storage is required.
Errors and Solutions
Error: The same customer is entered under different Client IDs. Solution: standardize the ID so all of that customer's completed services are grouped together. Error: a completed record does not appear in the dashboard. Solution: confirm that its service date is present and no later than the analysis cutoff. Error: more than one record becomes the first completion when a client has multiple completions on the same earliest date. Solution: inspect same-day records and correct duplicates or interpret them manually because the formula tests for strictly earlier dates. Error: new records below row 104 are ignored. Solution: extend the formulas, filters, formatting, and validation ranges before adding more service rows.
Frequently asked questions
What makes a client a repeat client?
A client is classified as Repeat when the same Client ID has at least two records marked Completed with valid service dates on or before the analysis cutoff.
How is a client's cohort month determined?
The cohort month is the first day of the month containing the client's earliest qualifying completed-service date.
Do booked, canceled, or no-show appointments affect retention metrics?
No. Those records can remain in the Services sheet, but completed-service counts, retention measures, return intervals, and completed revenue use qualifying records marked Completed.
When does the workbook flag a long return gap?
A completed return is flagged when its days since the prior qualifying completion exceed the editable threshold on Assumptions. The supplied threshold is 60 days.
How many service records can the workbook handle without modification?
The prepared input and formula ranges cover 100 records in rows 5 through 104. Additional rows require the formulas, validation, conditional formatting, and filter range to be extended.
Editorial responsibility

Tessa MarloweClient records and service workflows

Caleb HensleyWorkbook QA and operating controls