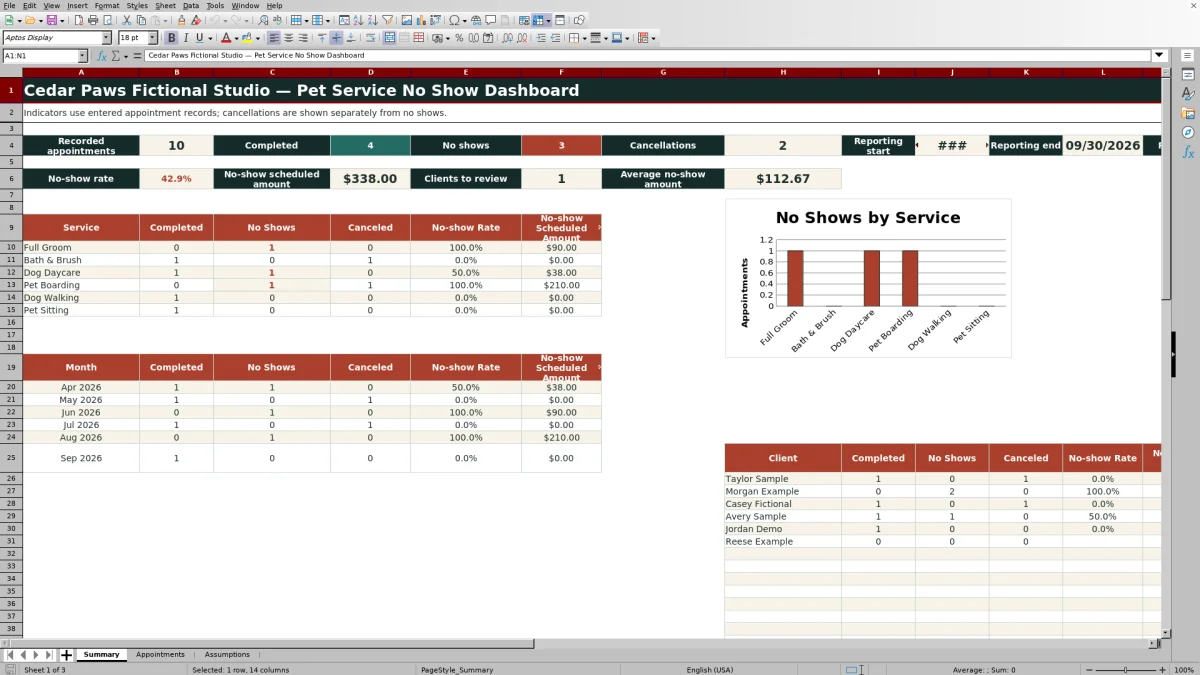
This Excel workbook is a pet service no-show dashboard for recording appointment outcomes and measuring missed appointments by client, service, and reporting period. Its appointment table provides 100 entry rows for dates, clients, pets, services, assigned team members, statuses, scheduled amounts, and booked hours.
The Summary sheet reports completed appointments, no shows, rates, and associated scheduled amounts while showing cancellations separately. Editable assumptions control the reporting dates, client review threshold, input limits, and lists used for validated appointment entry.
How this workbook can help
- Distinguishes no shows from cancellations so the dashboard does not treat every missed service as the same outcome.
- Reveals no-show patterns by service, month, and client within the selected reporting period.
- Quantifies the scheduled amount associated with no shows and calculates the average amount per missed appointment.
- Supports consistent appointment entry with controlled lists, input limits, calculated flags, and prompts for unresolved past appointments.
What is in the file
How to get started
1. Set the reporting window
Open Assumptions and enter the reporting window in the Reporting start and Reporting end cells. Confirm that the start date is not later than the end date.
2. Review the editable lists and limits
Replace the fictional client, service, and team-member entries within the supplied list ranges. Adjust the review count, allowed service dates, maximum booked hours, or maximum scheduled amount when needed.
3. Enter appointment records
Use rows 4 through 103 on Appointments to enter each appointment ID, service date, start time, client, pet, service, assigned team member, scheduled amount, and booked hours. Select the final status from Scheduled, Completed, No Show, or Canceled.
4. Resolve status prompts
Review the Check column. When a past appointment still has Scheduled status, confirm what happened and update the status manually rather than assuming it was a no show.
5. Interpret the dashboard
Use Summary to compare completed appointments, no shows, and cancellations. Review the service, month, and client sections together before deciding whether reminders, deposits, scheduling changes, or client follow-up merit consideration.
What the pet service no-show dashboard measures
The dashboard counts appointment records whose service dates fall between the reporting start and end dates. It recognizes Completed, No Show, and Canceled as distinct statuses, then reports totals and financial context without combining cancellations with no shows. Headline indicators include the number of recorded appointments, each outcome count, the no-show rate, the scheduled amount attached to no shows, the average no-show amount, and the number of clients marked for review.
How the no-show calculations work
The overall no-show rate is the no-show count divided by completed appointments plus no shows. Canceled appointments remain visible but are excluded from that denominator. The no-show scheduled amount sums Scheduled Amount only for records marked No Show, and the average no-show amount divides that sum by the number of no shows. Blank or invalid reporting dates cause applicable Summary results to remain blank rather than presenting a misleading period total.
Analyze patterns by service, month, and client
The service section compares completed, no-show, and canceled counts for each configured service and includes a no-show rate and scheduled amount. The monthly section applies the same measures over the reporting period. The client section adds a Human Check result tied to the configurable no-show review count, helping users interpret where follow-up is most useful instead of relying only on an overall percentage.
Practical example: interpret three appointment outcomes
Situation: suppose the reporting period contains only the three visible demonstration records—a $55 completed Bath & Brush appointment, a $38 Dog Daycare no show, and a $240 canceled Pet Boarding appointment. Action: retain each record's distinct status and review the Summary formulas. Result: the dashboard would show three recorded appointments, one completion, one no show, one cancellation, a 50% no-show rate, $38 in no-show scheduled amount, and a $38 average no-show amount. Interpretation: the $240 cancellation remains operationally visible but does not inflate the no-show count, amount, or rate denominator. Next decision: investigate the circumstances behind the Dog Daycare no show, but do not place that client into review solely from this one event when the configured threshold is two.
Comparison: dashboard versus a basic appointment list
This workbook treats a cancellation as a separate operational outcome, while a basic list may require manual filtering and calculation. The comparison clarifies when each approach is appropriate without suggesting that the dashboard replaces scheduling software or human review.
| Approach | No shows versus cancellations | Available breakdowns | Amount analysis | Best suited to |
|---|---|---|---|---|
| Pet service no-show dashboard | Reports the two outcomes separately | Service, month, and client | No-show scheduled amount and average | Structured review of up to 100 entered appointment records |
| Basic appointment list | Depends on manual status filtering | Depends on user-created filters or formulas | Requires manual calculation | Simple recordkeeping when analysis is not required |
| Calendar-only review | May show status labels but not summarized rates | Primarily date and time views | Not inherently summarized | Day-to-day scheduling rather than outcome analysis |
Common errors and solutions
If Summary cells are blank, confirm that both reporting dates are present and that the start date is not later than the end date. If Excel rejects an entry, check whether the date falls within the configured allowed range, the client or service appears in its supplied list, booked hours are within the maximum, and the scheduled amount does not exceed its limit. If Check status appears, a past appointment is still marked Scheduled; verify the outcome and update it manually. Avoid labeling a cancellation as No Show because doing so changes the no-show count, rate, and scheduled amount. Records beyond row 103 are outside the manifest-confirmed calculation ranges unless the workbook formulas and table are extended consistently.
Turn dashboard findings into the next scheduling decision
Begin with the overall rate, then inspect service and month results to determine whether the pattern is concentrated or widespread. Use the client review marker as a prompt rather than an automatic judgment, and verify source records before acting. A repeated issue may support consideration of reminders, confirmation procedures, deposits, or a scheduling-policy review, while an isolated event may call only for documentation and ordinary follow-up.
Frequently asked questions
What status counts as a no show?
An appointment counts as a no show only when its Status cell is set to No Show. Scheduled, Completed, and Canceled records are handled separately.
Are cancellations included in the no-show rate?
No. The rate divides no shows by completed appointments plus no shows, while cancellations are displayed in separate totals and breakdown columns.
How many appointment records can the workbook analyze?
The supplied Appointments table and Summary formulas cover rows 4 through 103, providing capacity for 100 appointment records.
Can the client, service, and team lists be customized?
Yes. Replace the fictional entries within the provided ranges on Assumptions. The manifest-confirmed validation ranges support up to 30 clients, 6 services, and 4 team members.
Why are some dashboard results blank?
Applicable results remain blank when a reporting date is missing or the reporting start is later than the reporting end. A rate may also remain blank when there are no completed appointments or no shows to form its denominator.
Does the Check column automatically classify a past appointment as a no show?
No. It displays Check status when a dated appointment is in the past but still marked Scheduled. A person must verify the outcome and select the appropriate final status.
Editorial responsibility

Tessa MarloweClient records and service workflows

Caleb HensleyWorkbook QA and operating controls