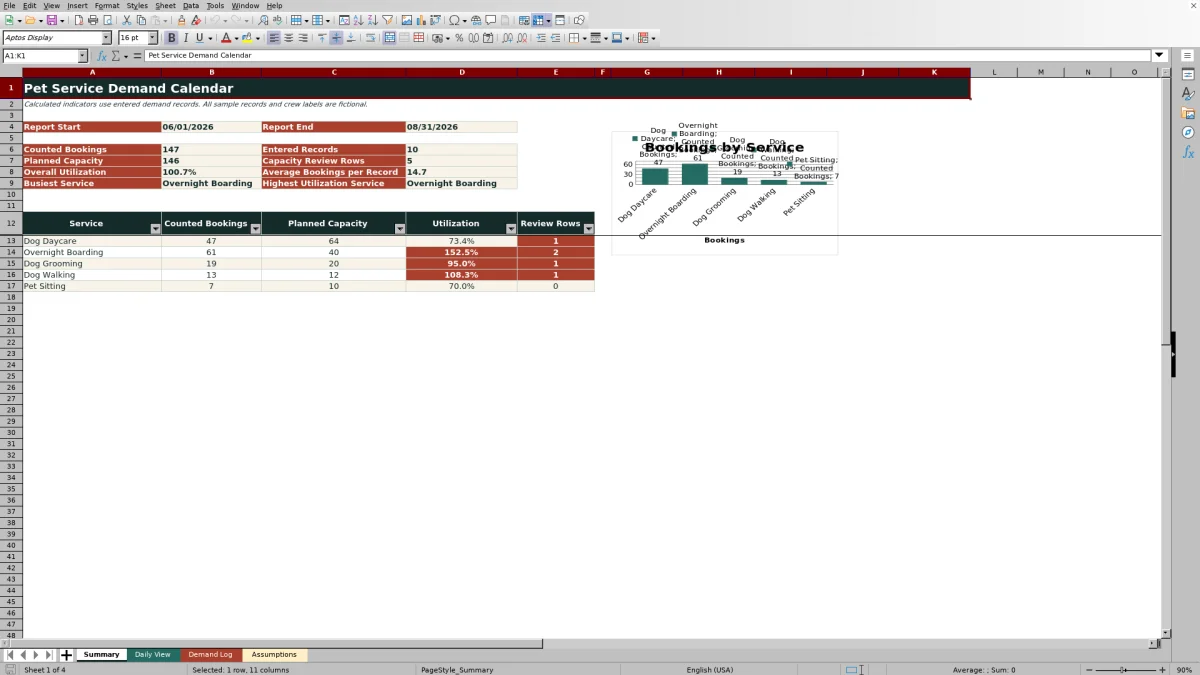
This Pet Service Demand Calendar Excel workbook organizes historical booking demand by service and date so pet-care operators can examine seasonal activity and prepare staffing plans. Its four worksheets connect an editable demand log with daily and service-level summaries.
The spreadsheet calculates counted demand, planned capacity, utilization, and review alerts from entered records and editable assumptions. It supports human scheduling decisions without presenting its capacity guides or alerts as automatic staffing rules.
How this workbook can help
- Connects booking history with planned staff capacity for more informed seasonal scheduling discussions.
- Shows daily demand by service for a selected month while keeping the underlying records available for review.
- Highlights dates and services that may require a capacity or staffing check.
- Separates editable assumptions, source records, monthly analysis, and reporting-period summaries into focused worksheets.
What is in the file
How to get started
1. Review the planning assumptions
Open Assumptions and confirm the five service names, capacity per staff values, status demand factors, allowed date range, and capacity review threshold. These settings drive calculations throughout the workbook.
2. Enter demand records
Use Demand Log to enter one record per service and date. Complete the record ID, service date, service, booking count, staff scheduled, lead assignment, status, and notes; the remaining demand and capacity fields calculate automatically.
3. Set the reporting dates and calendar month
Update the report start and end dates on Assumptions for the Summary sheet. Set the calendar control to the first day of the month you want Daily View to display.
4. Review results before changing staffing
Examine utilization, service totals, daily patterns, and Staffing Check messages. Investigate the underlying Demand Log rows and apply operational judgment before adjusting a schedule.
Situation: Seasonal Pet Service Scheduling
Pet-service demand can vary by date and service, making a single monthly total insufficient for staffing discussions. This workbook keeps one row per service and date in Demand Log, allowing booking counts, scheduled staff, status, assignment, and notes to remain connected to the calculated results.
Action: Configure and Record Demand
Begin by reviewing the five service slots and their capacity-per-staff values on Assumptions. Confirm the status factors—Completed, Confirmed, and Pending are initially counted at 1, while Canceled is counted at 0—then enter records in Demand Log. These are editable planning guides, so changes to assumptions flow into the workbook's demand and capacity calculations.
Result: Read Demand, Capacity, and Alerts
The workbook calculates planned capacity as staff scheduled multiplied by capacity per staff. Counted Demand is the booking count multiplied by the selected status factor, and utilization divides counted demand by planned capacity when valid positive capacity exists. Summary aggregates these measures for the selected report period, while Daily View organizes them by calendar date.
Interpretation: Practical Booking Example
The fictional June 15, 2026 Dog Daycare record contains 20 bookings, three scheduled staff, and a capacity guide of eight bookings per staff member. The action of entering those values produces planned capacity of 24; because the status is Completed with a factor of 1, counted demand remains 20. The result is 83.3% utilization, which is below the initial 90% review threshold and therefore reads Within guide. This means the row does not cross the configured alert level; it does not prove that three staff members are appropriate in every operational context. The next decision is to compare similar dates and consider local conditions before changing coverage.
Workbook View Comparison
Each worksheet answers a different planning question. The comparison below clarifies where to enter information, where to interpret it, and what each area does not attempt to provide.
| Workbook area | Primary role | Best used for | Practical limitation |
|---|---|---|---|
| Demand Log | Source records and row calculations | Entering bookings, staffing, status, assignments, and notes | Does not provide a consolidated seasonal view by itself |
| Daily View | Selected-month calendar analysis | Comparing daily demand across the five configured services | Displays one selected month rather than the full reporting period |
| Summary | Reporting-period totals and service metrics | Reviewing overall and service-level demand, capacity, utilization, and alerts | Aggregates records and is not a detailed shift schedule |
| Assumptions | Editable controls and lookup values | Maintaining capacities, status factors, dates, and the alert threshold | Provides planning inputs rather than operational guarantees |
Errors and Solutions
If a service or status does not match an available list value, lookup-based calculations can remain blank; select a validated list entry or correct the corresponding Assumptions value. If demand exists without positive planned capacity, the workbook returns Review staffing; verify the staff count and capacity guide, then assess the row manually. If Daily View does not populate, enter a valid date representing the first day of the desired month. If Summary appears empty, confirm that its start date is not later than its end date and that Demand Log contains dated service records within the selected period.
Next Decision: Turn Findings Into a Staffing Review
Use busy dates, high-utilization services, and review-row counts to identify where a closer operational review is warranted. Treat each message as a human planning prompt, then consider staff skills, service duration, facility constraints, animal-care requirements, and other information not modeled by the workbook before approving a staffing change.
Frequently asked questions
What does counted demand mean in this Excel workbook?
Counted demand is the entered booking count multiplied by the demand factor assigned to the selected status. The initial factor is 1 for Completed, Confirmed, and Pending and 0 for Canceled.
What causes a Review capacity message?
The message appears when calculated utilization is greater than the editable capacity review threshold on Assumptions. The initial threshold is 90%.
Why does Daily View show a blank day?
A blank day means no service record was entered for that date. The worksheet intentionally distinguishes dates without entered records from dates with calculated zero demand.
Can the calendar display any month?
Yes. Enter the first day of a month in the calendar control on Assumptions, using a date within the configured allowed range of January 1, 2020 through December 31, 2035.
Does the workbook automatically decide how many employees to schedule?
No. It compares entered demand with capacity derived from editable staff and service assumptions, then flags rows for review. Final staffing decisions require human judgment.
Editorial responsibility

Tessa MarloweClient records and service workflows

Caleb HensleyWorkbook QA and operating controls